There’s a big difference between basic system monitoring and performance monitoring. In the world of HPC, this distinction is greatly magnified. In the former case, monitoring often boils down to checking binary indicators to make sure system components are up or down, on or off, available or not. Red light/green light monitoring is certainly a requirement for IT operations, and HPC is no exception. But in the same way a quick triage of vital signs seldom reveals the underlying cause of a patient’s illness, standard systems monitoring tools can’t uncover the interdependencies of a complex HPC system.
Performance monitoring provides insights into system health that basic system monitoring just can’t reach.
There is no shortage of monitoring tools available, both open-source and commercial. Oddly, for an industry dealing with the most complex computing systems in the world, there’s very little published and/or discussed around HPC system performance monitoring and performance analysis. HPC performance analysis requires understanding at a deep level where and how systems components are interacting and most importantly, where bottlenecks lie.
Collecting both high-level and low-level performance data in a time series format is where it all starts. As stated above, there is no shortage of tools available. Because HPC systems are typically very performance-conscious, we look for lightweight low-impact tools for system and application performance data collection. But, let’s be frank, monitoring at this level comes at a cost. We need to start planning on setting aside some memory and CPU budget for performance monitoring. With the end of Moore’s law, we’re seeing increasingly complex HPC systems (e.g., more nodes with more cores, accelerators, complex network fabrics). All of these components are interconnected and each component creates an opportunity for performance degradation.
The value of being able to graphically represent time series performance data can’t be overstated. Tools like Graphite and Grafana allow administrators to rapidly plot time series data through a web interface. A lesser-known tool, SGI’s Performance CoPilot, has excellent capabilities in performance data collection, as well as the capability to intuitively display time series performance data. These tools allow for the visual comparison of known good baseline performance data against real-time or near real-time performance data.
No RedLine blog post would be complete without a comment on benchmarks and baselines. The ability to represent performance data from known benchmarks visually establishes your system performance baseline. Consistency in benchmark runs is to be expected and should be regularly measured. Assuming you can rule out change, reduced performance in a benchmark is indicative of performance degradation that should be identifiable through a visual comparison of “good” system baselines plotted as time series data.
Pulling it all together, here’s an example: A large parallel job that should take roughly 46 minutes to complete has a runtime of almost an hour. A comparison is made of a known good model run and the CPU, memory and I/O profiles are plotted. The CPU plots show the slow job is spending more time in I/O wait than the baseline. The I/O plots show aggregate throughput lower than the baseline. However, the up/down indicators of the storage array shows healthy: all lights are green.
Digging deeper in the I/O profile with our I/O throughput benchmark (IOR), we see aggregate throughput is slightly lower than that of the baseline performance for our Lustre filesystem. In addition, the baseline runs roughly 11 minutes and our benchmark run took just over 13 minutes (Figures 1 and 2).


Analyzing individual disk performance shows erratic disk performance as compared to the baseline.

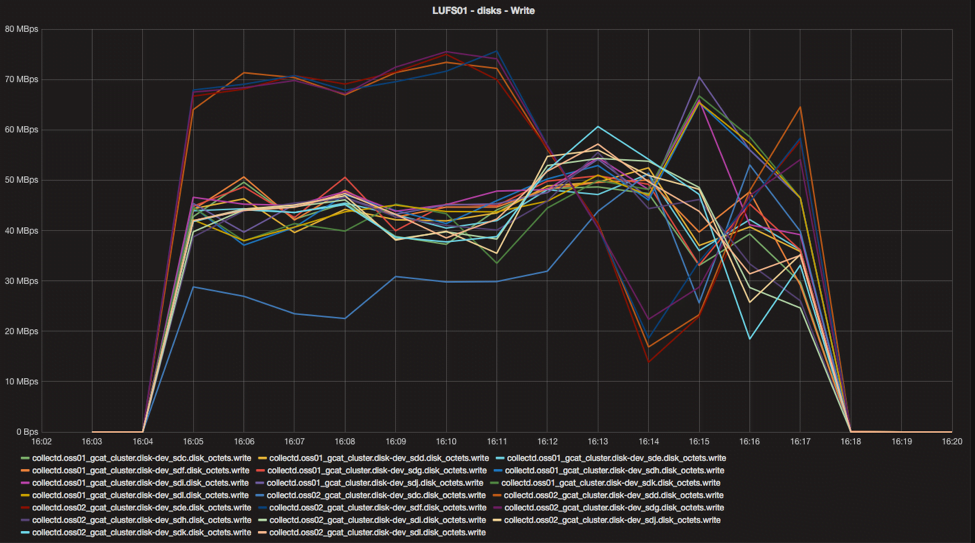
Baseline data in Figure 3 shows that the physical disks associated with each of the four ZFS Zpools to be tightly coupled. In Figure 4, we see that one disk is significantly slower and four disks are “overachieving” as compared to the baseline. These five disks are associated with the same RAID 6 ZFS Zpool. Further investigation into this issue revealed that tuning procedures were not applied as per our documented procedures after replacement of a failed disk drive. Upon applying the appropriate tuning procedures to the replaced disk, performance was restored to normal.
In HPC environments, problems with similar symptoms are commonplace. The cause, however, could be the result of any number of issues. For instance, a compute node with a slow CPU or bad memory can cause similar slowness in a parallel model. Having good performance data collection, good data visualization capability, coupled with baselines and benchmarks leads to faster problem determination and reduced mean time to repair (MTTR).
Making the investment in performance monitoring will have long lasting benefits that far outstrip the cost of implementation. If you would like to learn more about how to implement effective performance monitoring in your HPC environment, reach out. Or stop by Booth 4460 during SC16 this month for a conversation.
Editor’s Note: RedLine Vice President and Chief Technical Officer Don Avart, and Engineer Chris Young, contributed to this article.